
DELHI POLLUTION TRENDS DOWNWARD: CAPITAL CITY MARKS LOWEST PARTICULATE MATTER LEVELS SINCE 2018 AS AQI SHOW RESULTS

“CLEAR SKIES, A FAINT MEMORY FOR DELHI OR PERHAPS NOT?”
According to the official monitoring data released by the Press Information Bureau indicates a gradual and sustained decline in particulate matter air pollution across the national capital over recent years. Pollution levels caused by particulate matter, both coarse dust (PM10) and fine invisible particles (PM2.5) have been steadily decreasing over recent years in New Delhi. Barring 2020, COVID-19 period, it has shown a steady decrease which is quite reaffirming. During COVID-19 period 2020, abnormally low pollution levels were shown due to lockdowns and the other measures taken. Apart from the temporary shutdown year ,2025 recorded the lowest annual average pollution levels seen so far. This data shows genuine decrease in pollution levels which is a long term improvement rather than just a temporary lockdown drop.
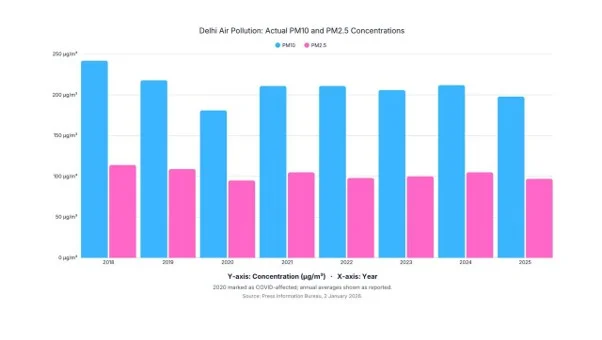
The data given tracks annual pollution metrics from 2018 to 2025, detailing daily average values measured in micrograms per cubic metre. In 2018, Delhi recorded a daily average PM10 concentration of 242 μg/m³ and a PM2.5 concentration of 114 . These figures saw a steady downward trajectory in subsequent years, dropping to 218 μg/m³ for PM10 and 109 μg/m³ for PM2.5 in 2019, before dipping to 180 μg/m³ and 95 μg/m³ respectively during the pandemic-affected year of 2020.
After a return to normal economic activity post pandemic, levels of pollution were stable for some time. In 2021 & 2022 the daily average PM10 was 211 μg/m³. This decreased in 2023 to 206 μg/m³. In 2024 there was a small increase to 212 μg/m³ but then levels dropped again to reach a new baseline minimum of 198 μg/m³ in 2025.
A similar trend was seen for fine particulate matter (PM2.5) as well, which is very hazardous to human health as it can affect respiratory tract. Average PM2.5 levels stood at 105 μg/m³ in 2021, 98 μg/m³ in 2022, 100 μg/m³ in 2023, 105 μg/m³ in 2024, and dropped to 97 μg/m³ in 2025. For the first time outside the lockdown period, annual PM10 levels dropped below the 200 μg/m³ threshold, while PM2.5 levels approached the lockdown era benchmark through targeted structural measures rather than sudden economic halts.
The current scenario reflects a combination of sustained efforts at ground level backed by some specific policy interventions. Stringent emission standards for industries, better dust control using machinery, stringent vehicle standards and local action plans have helped bring down the baseline pollution levels. Although, the adverse winter meteorological conditions are causing periodic spikes, the overall air quality in Delhi is expected to show sustained and significant improvement in the coming years.
Major Takeaways from the Report
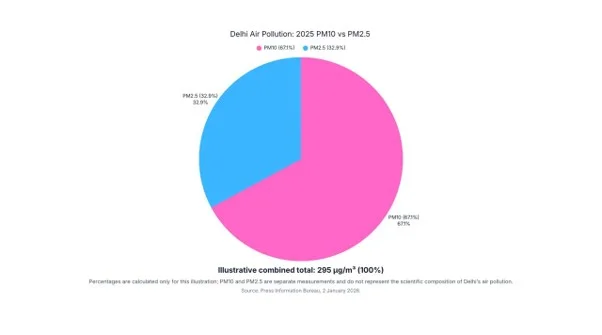
1. 2025 is the cleanest year in the table, except 2020. Delhi’s annual average PM10 was 198 µg/m³ and PM2.5 was 97 µg/m³ in 2025. Only the lockdown year of 2020 was lower. Therefore, the headline of the report is true, as far as these eight years go.
2. The fall is real but small. From 2018 to 2025, PM10 dropped by 44 µg/m³ (about 18%) and PM2.5 by 17 µg/m³ (about 15%). That is my own calculation from the table. But from 2021 to 2025 the drop is only about 6% for PM10 and about 8% for PM2.5. Therefore, most of the fall came early, and the last four years mostly moved sideways.
3. It was not steady. The report says pollution has been “steadily decreasing”. The numbers do not say that. PM10 went 211, 211, 206, 212, 198 from 2021 to 2025. PM2.5 went 105, 98, 100, 105, 97. Both rose in 2024. Therefore the line goes down and up, and the honest word is uneven.
4. 2020 shows what a shutdown does. With the roads and factories shut, PM10 fell to 181 and PM2.5 to 95. In 2021 they were back at 211 and 105. The report says the 2025 drop is a “long term improvement” and not a lockdown drop. Look at PM2.5 and that argument is strong, because 97 is only 2 above the lockdown year.
5. The 200 mark is a round number, not a safe limit. The report says PM10 went under 200 for the first time outside the lockdown. It did so by 2 µg/m³. India’s yearly limits are 60 for PM10 and 40 for PM2.5 (check these in the CPCB table before you cite them). Therefore, 198 is about three times the limit, and 97 is about two and a half times the limit. “Lowest on record” is not the same as “safe”.
6. The reasons are the government’s own explanation. The report gives credit to tougher industry emission standards, dust control machinery, vehicle standards and local action plans. That is what CAQM says. The data does not test it. Weather, rain and farm fires also change the numbers each year. Therefore, we can say the numbers fell. We cannot say the policies made them fall.
7. Winter still spoils the year. The report admits that bad winter weather causes spikes. CAQM said the PM2.5 average up to 27 November 2025 was 85 µg/m³ (India.com, 2025). The full year came out at 97. Therefore, the last five weeks of the year pushed the average up by about 12, and one bad winter can wipe out a lot of good months.
8. The last line is a forecast, not a result. The report ends by expecting “sustained and significant improvement” in the coming years. Nothing in the eight years of data proves that. It is hope. Therefore, we should quote it as what CAQM expects, and not as a finding.
Limitations (Of Data Itself)
Yearly averages hide the seasons. One number covers the clean monsoon weeks and the smoke of November and December. Therefore, a bad winter and a steady year can look alike.
We are not told how the number is built. The release gives no count of monitoring stations, and does not say if the same stations were used each year. A change in stations can move an average without the air changing.
Only eight data points. Eight years, with 2020 pulling the picture out of shape, is a thin base for the word “trend”. Swings of 5 or 6 points show up between years, so small moves are hard to trust.
Weather is left out. Rain, wind and temperature change pollution from year to year. Nothing here separates them from the effect of policy.
The source is also the body being measured. The figures come from the Ministry of Environment and CAQM, who are also the ones taking credit for the improvement. That does not make the numbers wrong. It means there is no independent check in the report.
Only two pollutants. PM10 and PM2.5 are part of the picture. Nitrogen dioxide, Ozone and Sulphur dioxide are missing, and so is anything about health.
Sources
India.com. (2025, November 30). Did Delhi air quality worsen in 2025? CAQM says capital logged lowest Jan-Nov AQI since…, PM2.5 levels were… https://www.india.com/news/india/did-delhi-air-quality-worsen-in-2025-caqm-says-capital-logged-lowest-jan-nov-aqi-since-2018-pm2-5-levels-were-at-par-with-2020-delhi-pollution-delhi-weather-delhi-aqi-8207989/
Ministry of Environment, Forest and Climate Change. (2026, January 2). During the period 2018-2025, Delhi witnessed its lowest average PM10 and PM2.5 concentration levels in the current year, barring COVID year 2020 [Press release]. Press Information Bureau. https://www.pib.gov.in/PressReleasePage.aspx?PRID=2210935®=48&lang=2
Press Trust of India. (2026, January 2). Delhi recorded lowest PM levels in seven years during 2025, says CAQM. The Federal. https://thefederal.com/category/states/north/delhi/delhi-recorded-lowest-pm-levels-in-7-years-during-2025-says-caqm-223733
Continue reading
 Journalism
One Seat Multiple Stakes
15 October 2026
By-elections may involve fewer voters, but their political consequences can be significant. From historic victories to closely contested seats, they shape leadership, test political strength, and uphold representation, proving that even a single seat can influence the broader democratic landscape.
 Journalism
Transparency, Verifiability and Accessibility of Voter List in India
9 October 2026
India’s electoral roll revision has sparked questions about transparency, accountability and the risk of eligible voters being excluded. As scrutiny of the Election Commission intensifies, the central challenge is balancing accurate voter lists with citizens’ right to participate in democracy.
 Journalism
A ROLL CALL FOR DEMOCRACY
1 October 2026
The Supreme Court has upheld the Election Commission’s mass voter-list revision, yet internal objections from two of its own commissioners and Opposition charges of irregularities keep the debate over electoral trust alive across India.
Comments
Your comment